PayloopPayloop
CommunityVoicesToolsDiscoverLeaderboardReportsBlog
Save Up to 65% on AI
Powered by Payloop — LLM Cost Intelligence
Tools/Lightdash/vs Observable
Lightdash

Lightdash

ai-analytics
vs
Observable

Observable

ai-analytics

Lightdash vs Observable — Comparison

15 integrations12 featuresSeries A
15 integrations10 featuresSeries B
The Bottom Line

Lightdash excels in providing a user-friendly, open-source BI platform with strong integration features, such as dbt, and is cost-effective for data teams looking for effortless insights. Observable, praised for its interactive data visualization and collaborative capabilities, caters more towards teams familiar with JavaScript and focused on exploratory data analysis.

Best for

Lightdash is the better choice when teams require a BI tool that seamlessly integrates with data warehouses and are focused on real-time data visualization for business performance tracking.

Best for

Observable is the better choice when teams need a dynamic, collaborative environment for building interactive data visualizations and are comfortable with JavaScript.

Key Differences

  • 1.Lightdash provides real-time data visualization and role-based access control, which are beneficial for immediate business analytics, whereas Observable focuses on interactive visualizations through JavaScript with a steeper learning curve.
  • 2.Lightdash offers advanced collaboration tools and version control, which streamline teamwork on data projects, while Observable enables real-time collaboration through live coding environments.
  • 3.Pricing for Lightdash starts at $3000/month, which may be more cost-effective for larger teams, compared to Observable's tiered pricing starting at $10/month aimed at smaller projects.
  • 4.Lightdash has automated reporting and alert features, enhancing operational efficiency, whereas Observable's strength lies in its ability to facilitate prototype data visualizations and share interactive dashboards effectively.
  • 5.With a Series A funding of $21.8M, Lightdash is focused on expanding its BI capabilities, contrasting Observable's Series B funding of $46.1M, which supports its comprehensive JavaScript-based notebook offerings.

Verdict

Lightdash is well-suited for data teams looking for a robust BI solution with strong integration capabilities and competitive pricing. On the other hand, Observable is ideal for teams focusing on data exploration and interactive visualizations, especially if they possess the requisite JavaScript skills. Companies must consider their specific needs in terms of integration, pricing, and team skills when choosing between them.

Overview
What each tool does and who it's for

Lightdash

Lightdash is the AI-first, open-source BI platform for modern data teams. Connect to dbt, define metrics once, and get instant, trustworthy insights.

Lightdash is praised for its user-friendly interface and efficient data visualization capabilities, making it a strong choice for teams looking to quickly derive insights from data. Users appreciate its seamless integration with existing data pipelines, which enhances its functionality for data professionals. However, some users have raised concerns about occasional performance lags, which can disrupt workflow. In terms of pricing, feedback is largely positive, as many find it competitively priced compared to similar tools, contributing to its solid overall reputation in the analytics community.

Observable

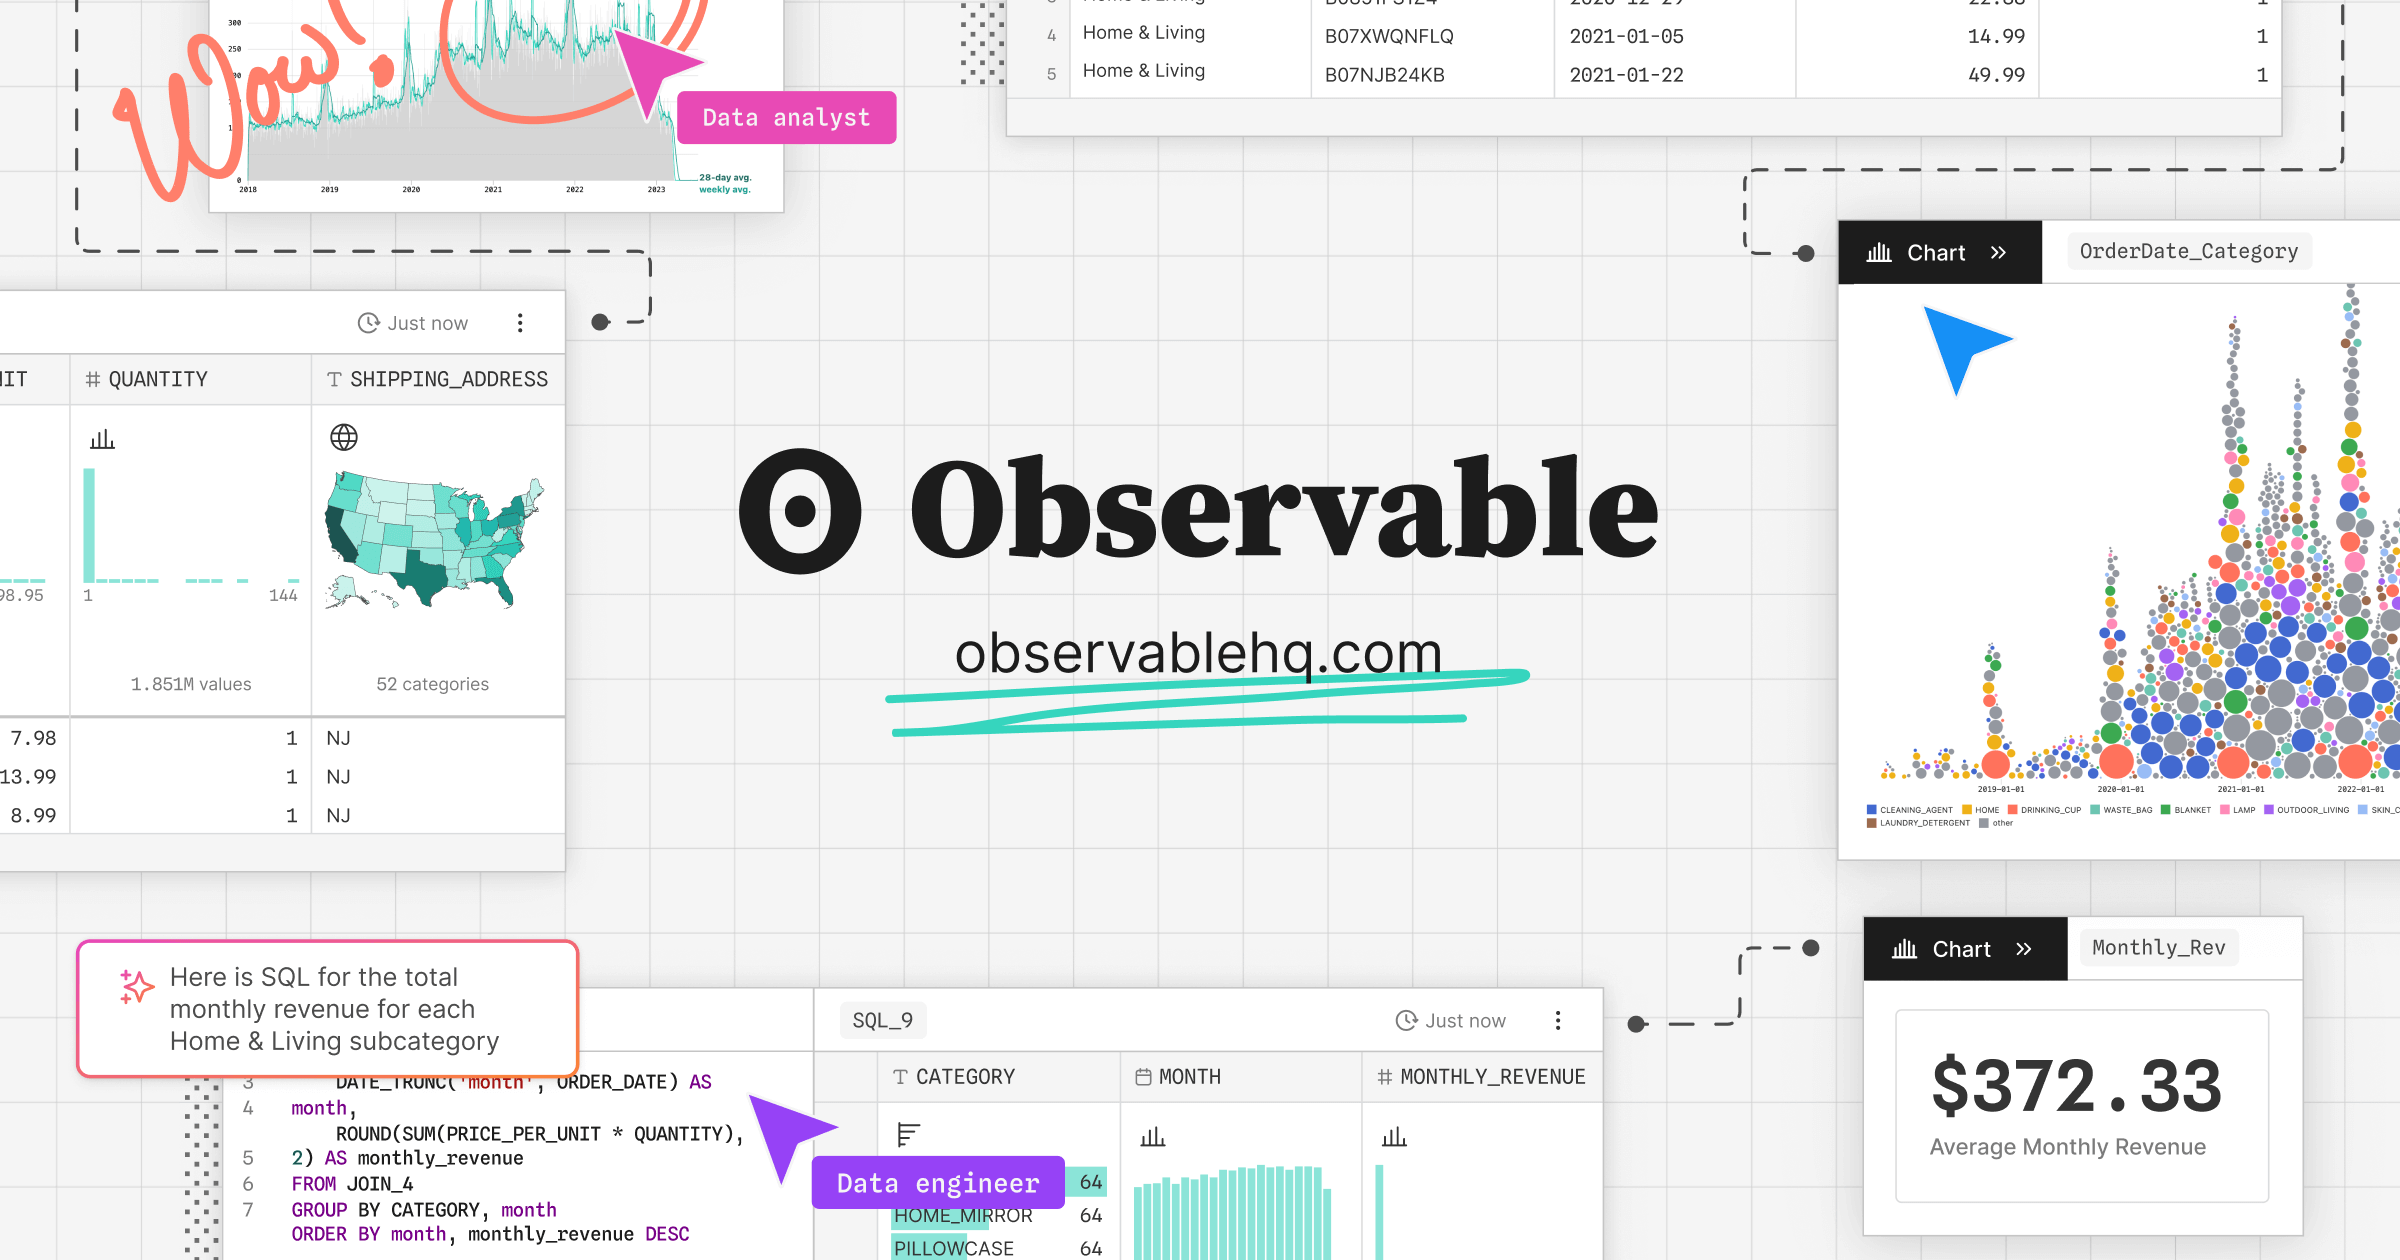
Quickly explore and analyze data, build prototype data visualizations, and collaborate with your team in real-time with live JavaScript notebooks.

Observable has been positively received for its interactive data visualization capabilities, allowing users to easily create and share dynamic visualizations in a collaborative environment. Key complaints primarily revolve around a steep learning curve for new users, especially those unfamiliar with JavaScript. Sentiment regarding pricing is generally neutral, with some users finding value in its offerings but others noting it can be pricey for small projects. Overall, Observable is regarded as a powerful tool within data science communities, particularly valued for its flexibility and collaborative features.

Key Metrics
—
Mentions (30d)
13
Mention Velocity
How discussion volume is trending week-over-week

Lightdash

Not enough data

Observable

+23% vs last week
Where People Discuss
Mention distribution across platforms

Lightdash

YouTube
100%

Observable

Reddit
94%
YouTube
6%
Community Sentiment
How developers feel about each tool based on mentions and reviews

Lightdash

0% positive100% neutral0% negative

Observable

0% positive100% neutral0% negative
Pricing

Lightdash

usage-based + subscription + contract + per-seat + tieredFree tier

Pricing found: $3000 / month, $0.05/load, $790/month, $490

Observable

subscription + tiered

Pricing found: $22/mo, $10/mo

Use Cases
When to use each tool

Lightdash (6)

Business performance trackingSales data analysisMarketing campaign effectiveness measurementFinancial reporting and forecastingCustomer behavior analysisOperational efficiency monitoring

Observable (8)

Data visualization for exploratory data analysisCollaborative data science projects with team membersCreating interactive dashboards for business insightsEducational purposes for teaching data analysis conceptsPrototyping machine learning models with real-time dataConducting statistical analysis and hypothesis testingBuilding custom data applications for specific needsSharing research findings in an interactive format
Features

Only in Lightdash (12)

Customizable dashboardsSQL-based data modelingReal-time data visualizationCollaboration tools for teamsData exploration capabilitiesUser-friendly interface for non-technical usersIntegration with popular data warehousesAutomated reporting and alertsRole-based access controlVersion control for data modelsAPI access for developersMobile-friendly design

Only in Observable (10)

Literate programmingConnect to any dataBuilt-in reactivityImportsFork mergeEmbedsDatabasesFilesInputsMinimap
Integrations

Shared (7)

PostgreSQLMySQLTableauSlackGoogle SheetsZapierGitHub

Only in Lightdash (8)

SnowflakeBigQueryRedshiftLookerAirflowSegmentFivetranStitch

Only in Observable (8)

MongoDBFirebaseAWS S3Microsoft ExcelD3.jsPlotlyStripeTwilio
Developer Ecosystem
20
npm Packages
—
Pain Points
Top complaints from reviews and social mentions

Lightdash

No complaints found

Observable

token usage (1)claude code cost (1)token cost (1)API costs (1)
Top Discussion Keywords
Most mentioned keywords from community discussions

Lightdash

No data

Observable

token usage (1)claude code cost (1)token cost (1)API costs (1)
Latest Videos
Recent uploads from official YouTube channels

Lightdash

Lightdash TV - Live Lightdash demos, feature deep dives, data podcasts & a bit of fun ⚡️

Lightdash TV - Live Lightdash demos, feature deep dives, data podcasts & a bit of fun ⚡️

Apr 13, 2026

Lightdash CLI: Manage your entire BI layer from the terminal

Lightdash CLI: Manage your entire BI layer from the terminal

Apr 13, 2026

Lightdash CLI: Catch broken metrics before they reach production

Lightdash CLI: Catch broken metrics before they reach production

Apr 8, 2026

From Prompt to Dashboard in Minutes: A Live Agentic BI Demo

From Prompt to Dashboard in Minutes: A Live Agentic BI Demo

Mar 4, 2026

Observable

Happy 15th birthday, D3!

Happy 15th birthday, D3!

Mar 25, 2026

Visualizing parts of a whole | Observable

Visualizing parts of a whole | Observable

Mar 25, 2026

10 map types for visualizing spatial data

10 map types for visualizing spatial data

Mar 24, 2026

The evolving data analysis landscape: How data teams can stay competitive in 2026

The evolving data analysis landscape: How data teams can stay competitive in 2026

Feb 5, 2026

Product Screenshots

Lightdash

Lightdash screenshot 1

Observable

Observable screenshot 1Observable screenshot 2Observable screenshot 3Observable screenshot 4
Top Community Mentions
Highest-engagement mentions from the community

Lightdash

Lightdash AI

Lightdash AI

YouTubeneutral source

Observable

Observable AI

Observable AI

YouTubeneutral source
Company Intel
information technology & services
Industry
information technology & services
27
Employees
28
$21.8M
Funding
$46.1M
Series A
Stage
Series B
Supported Languages & Categories

Shared (4)

DevOpsSecurityAnalyticsDeveloper Tools

Only in Lightdash (1)

Marketing
Frequently Asked Questions
Is Lightdash or Observable better for financial reporting?▼

Lightdash is better suited for financial reporting as it offers automated reporting and real-time data visualization, which are crucial for accurate forecasting.

How does Lightdash pricing compare to Observable?▼

Lightdash's pricing, starting at $3000/month with a free tier, is generally more suited for larger organizations, while Observable's lower entry point of $10/month may appeal to smaller teams or those with a tighter budget.

Which has better community support, Lightdash or Observable?▼

Observable typically has a more engaged community due to its established presence in the data science domain and higher funding, which fosters greater collaboration and shared resources.

Can Lightdash and Observable be used together?▼

While both tools serve overlapping purposes in data visualization, they can be used together to complement each other's strengths, with Lightdash handling BI tasks and Observable focusing on exploratory analysis.

Which is easier to get started with, Lightdash or Observable?▼

Lightdash is generally easier to get started with due to its user-friendly interface specifically designed for non-technical users, as opposed to Observable, which may require familiarity with JavaScript.

View Lightdash Profile View Observable Profile