Observable excels in providing interactive data visualizations within a collaborative environment, appealing to data scientists familiar with JavaScript, whereas Datagran focuses on integrating AI-driven analytics and process automation, suited for teams looking for comprehensive data processing. Observable offers flexibility in visualization while Datagran provides end-to-end pipeline solutions, each backed by substantial funding amounts of $46.1M and $4.4M respectively.
Best for
Datagran is the better choice when an enterprise seeks to automate and optimize data workflows with AI-driven tools and seamless integrations.
Best for
Observable is the better choice when a team needs to create dynamic, interactive data visualizations and has a solid understanding of JavaScript.
Key Differences
Verdict
Observable is ideal for technical teams focused on data visualization and who are comfortable with JavaScript’s ecosystem, leveraging interactive analytics. Conversely, Datagran suits organizations aiming for broad AI-based data handling and process optimization. Each tool brings unique strengths, with Observable being chosen for depth in data interaction and Datagran for breadth in process automation across integrations.
Datagran
Datagran helps companies rebuild work around human-led cells powered by AI agents, enterprise intelligence, Groovy, and Persona360.
Users generally appreciate Datagran for its powerful AI-driven capabilities and user-friendly interface that streamlines data management and automation. However, there are key complaints regarding occasional performance issues and a steep learning curve for new users. Pricing is viewed as reasonable by some, considering the advanced features offered, though others feel it might be on the higher end for smaller businesses. Overall, Datagran holds a solid reputation as a robust tool for data integration and process automation.
Observable
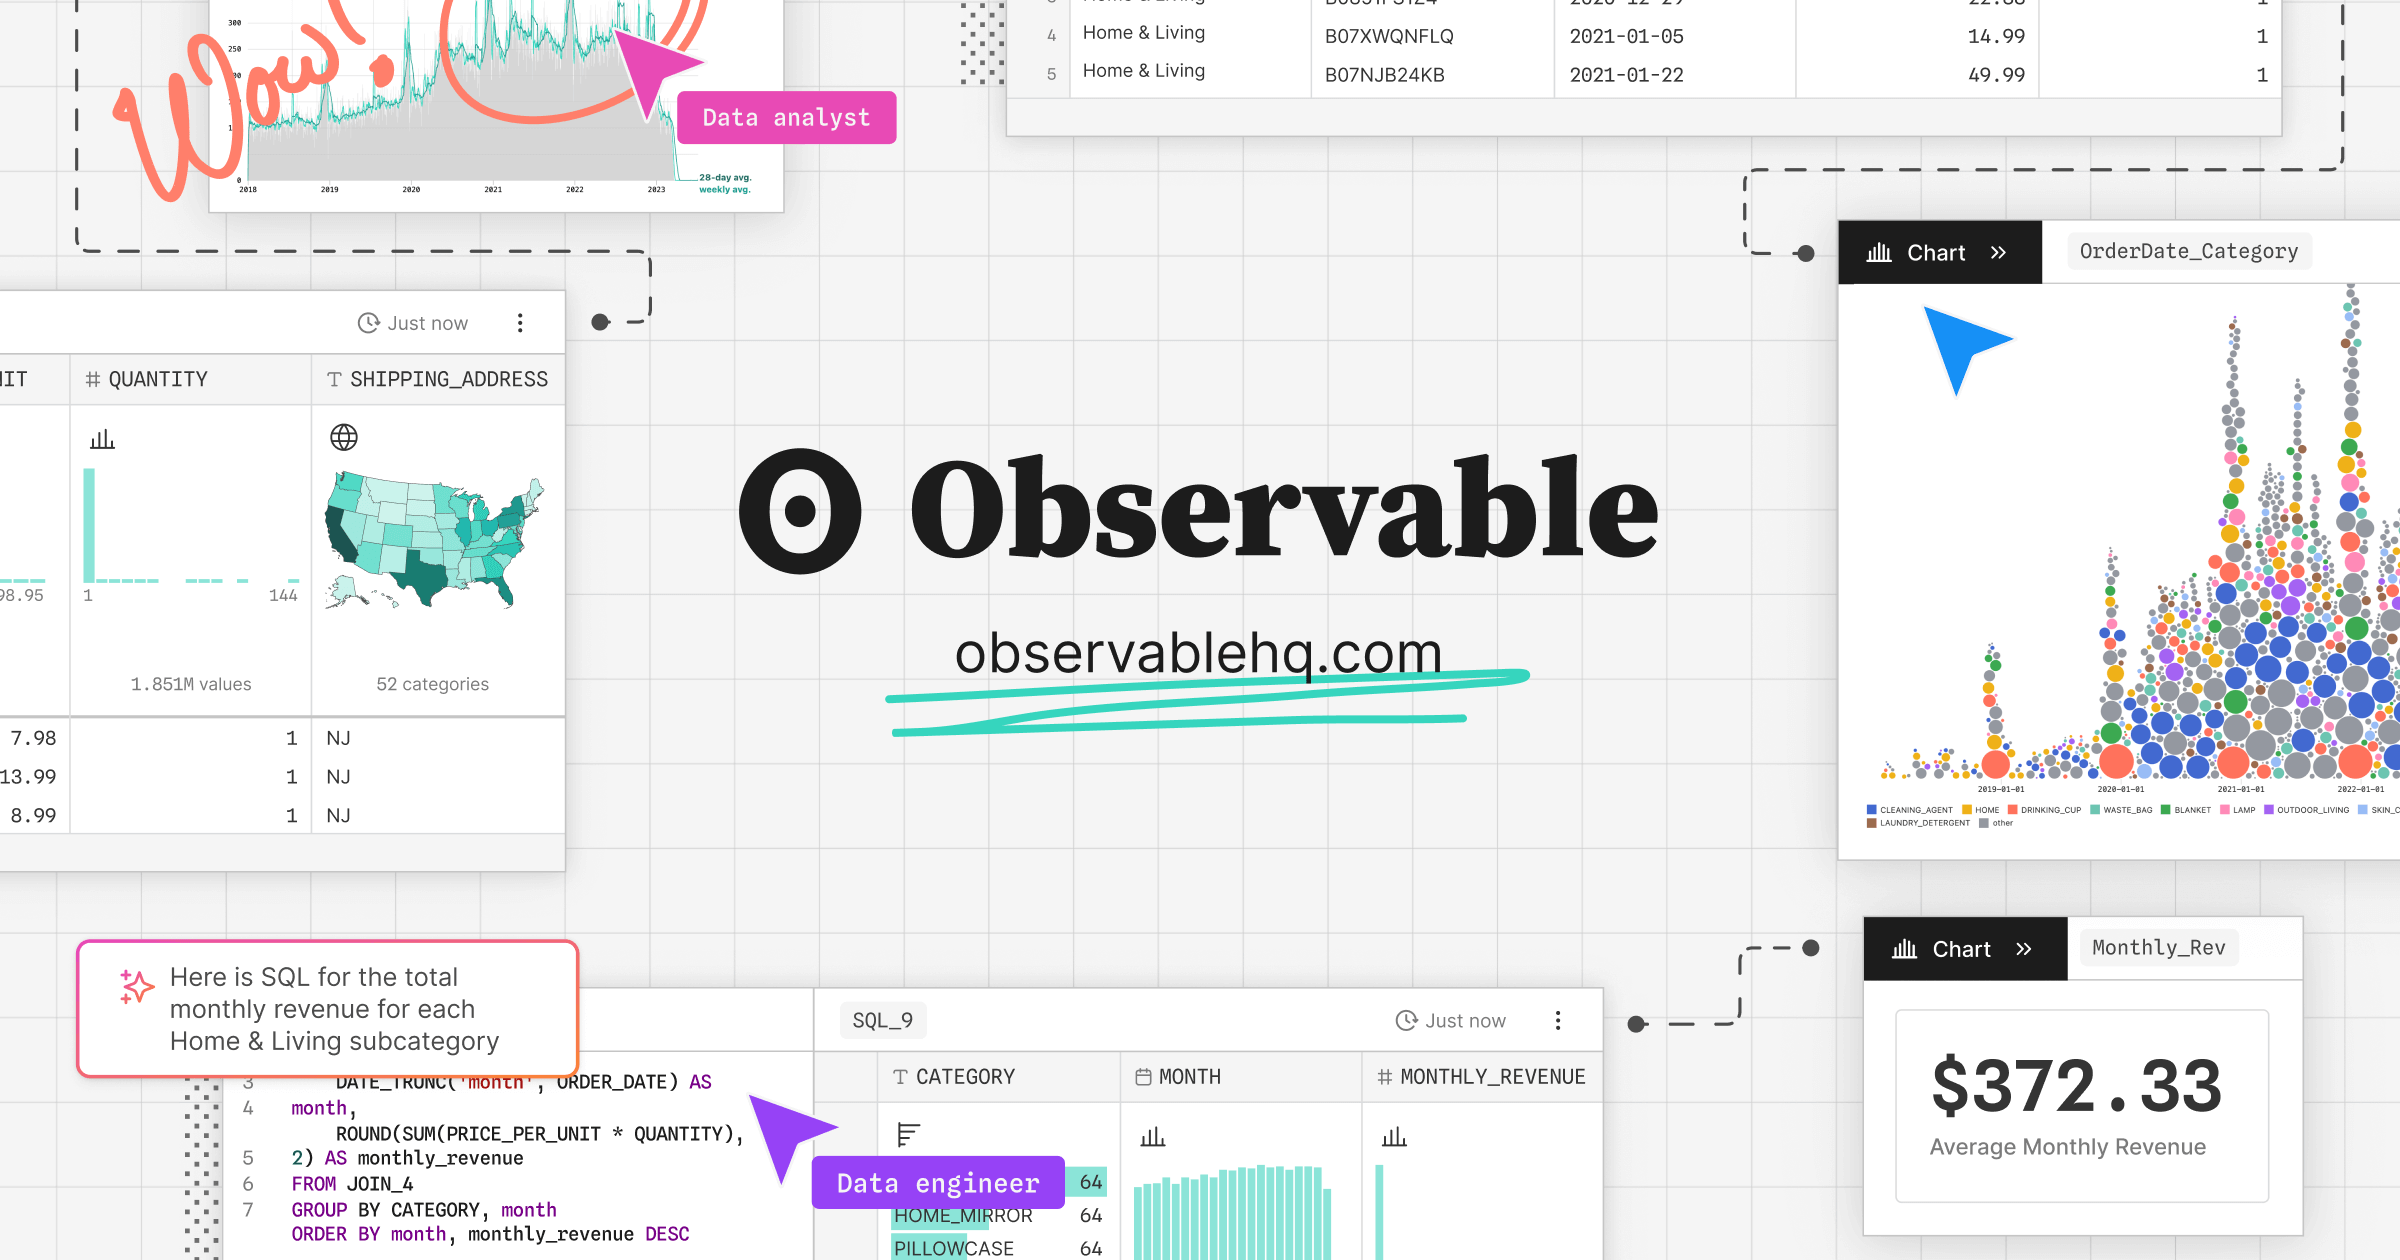
Quickly explore and analyze data, build prototype data visualizations, and collaborate with your team in real-time with live JavaScript notebooks.
Observable has been positively received for its interactive data visualization capabilities, allowing users to easily create and share dynamic visualizations in a collaborative environment. Key complaints primarily revolve around a steep learning curve for new users, especially those unfamiliar with JavaScript. Sentiment regarding pricing is generally neutral, with some users finding value in its offerings but others noting it can be pricey for small projects. Overall, Observable is regarded as a powerful tool within data science communities, particularly valued for its flexibility and collaborative features.
Datagran
Not enough dataObservable
+23% vs last weekDatagran
Observable
Datagran
Observable
Datagran
Observable
Pricing found: $22/mo, $10/mo
Datagran (8)
Observable (8)
Only in Datagran (10)
Only in Observable (10)
Shared (4)
Only in Datagran (11)
Only in Observable (11)
Datagran
No complaints found
Observable
Datagran
No data
Observable
Datagran
No screenshots
Observable


Datagran
Observable
Shared (1)
Only in Datagran (3)
Only in Observable (3)
Observable is better suited for data visualization tasks given its focus on interactive data graphics and notebook environment.
Observable's pricing starts at $10/month with tier-based offerings, which some find pricey for smaller projects, while Datagran provides tiered pricing perceived as competitive for its broad feature set.
Observable holds a stronger position within data science communities particularly for its collaborative visualization capabilities, despite Datagran's robustness in integration.
Technically, these tools can complement each other, with Observable handling visualization and Datagran managing data pipeline operations, but they do not have direct integration paths.
Datagran might be easier initially for users familiar with its integrated platforms and AI tools, whereas Observable requires significant JavaScript knowledge which may deter new users.