See metrics from all of your apps, tools & services in one place with Datadog’s cloud monitoring as a service solution. Try it for free.
Datadog is highly regarded for its robust monitoring and analytics capabilities, with consistent user praise highlighting its comprehensive dashboards and real-time data monitoring features. Some users express concerns about the complexity of setup and the learning curve, as well as occasional integration challenges. Pricing sentiment appears to be mixed, with some users finding it a worthwhile investment given its extensive features, while others consider it on the higher side. Overall, Datadog enjoys a strong reputation in the market, supported by a significant number of high ratings but tempered by a few notable criticisms.
Mentions (30d)
2
Avg Rating
4.4
20 reviews
Platforms
2
Sentiment
9%
1 positive


Datadog is highly regarded for its robust monitoring and analytics capabilities, with consistent user praise highlighting its comprehensive dashboards and real-time data monitoring features. Some users express concerns about the complexity of setup and the learning curve, as well as occasional integration challenges. Pricing sentiment appears to be mixed, with some users finding it a worthwhile investment given its extensive features, while others consider it on the higher side. Overall, Datadog enjoys a strong reputation in the market, supported by a significant number of high ratings but tempered by a few notable criticisms.
Features
Use Cases
Industry
information technology & services
Employees
8,100
20
npm packages
14
HuggingFace models
Pricing found: $1, $2, $240, $200, $160
g2
What do you like best about Datadog?I really like that Datadog gives us developers a unified view into multiple aspects of the software's development lifecycle. It handles logging, metrics, observability, telemetry, and error reporting all together. I specifically appreciate being able to filter logs based on multiple aspects and set parameters, which makes it easy to check logs for particular users or domains. It also simplifies the visualization of log occurrences through pie charts, graphs, and histograms, and these can be exported and shared with colleagues to derive insights. Additionally, the initial setup is straightforward, and the enterprise team helps streamline things, while there is ample online support and community resources available for problem-solving. Review collected by and hosted on G2.com.What do you dislike about Datadog?Sometimes the UI can appear messy and cluttered, especially to novice users. It made me feel overwhelmed when I first started using it because there were so many buttons and features, which makes the learning curve a bit steep for newcomers. Review collected by and hosted on G2.com.
What do you like best about Datadog?What I like most about Datadog is that it can act as a single source of truth for our entire stack, helping break down the silos between infrastructure metrics, APM, and log management. During an incident, instead of jumping between three different tools, my team can quickly pivot from a spiked CPU metric to the relevant trace and the corresponding logs in just a couple of clicks. Review collected by and hosted on G2.com.What do you dislike about Datadog?The learning curve is pretty steep. Since Datadog has expanded into so many areas (Security, CI Visibility, Real User Monitoring), the UI can feel cluttered and overwhelming—especially for new team members. On top of that, the cost of log indexing and retention is a major hurdle. I like the 'Logging without Limits' concept in theory, but the price gap between ingesting logs and actually being able to search them (indexing) forces us to make tough decisions about what data to keep. Review collected by and hosted on G2.com.
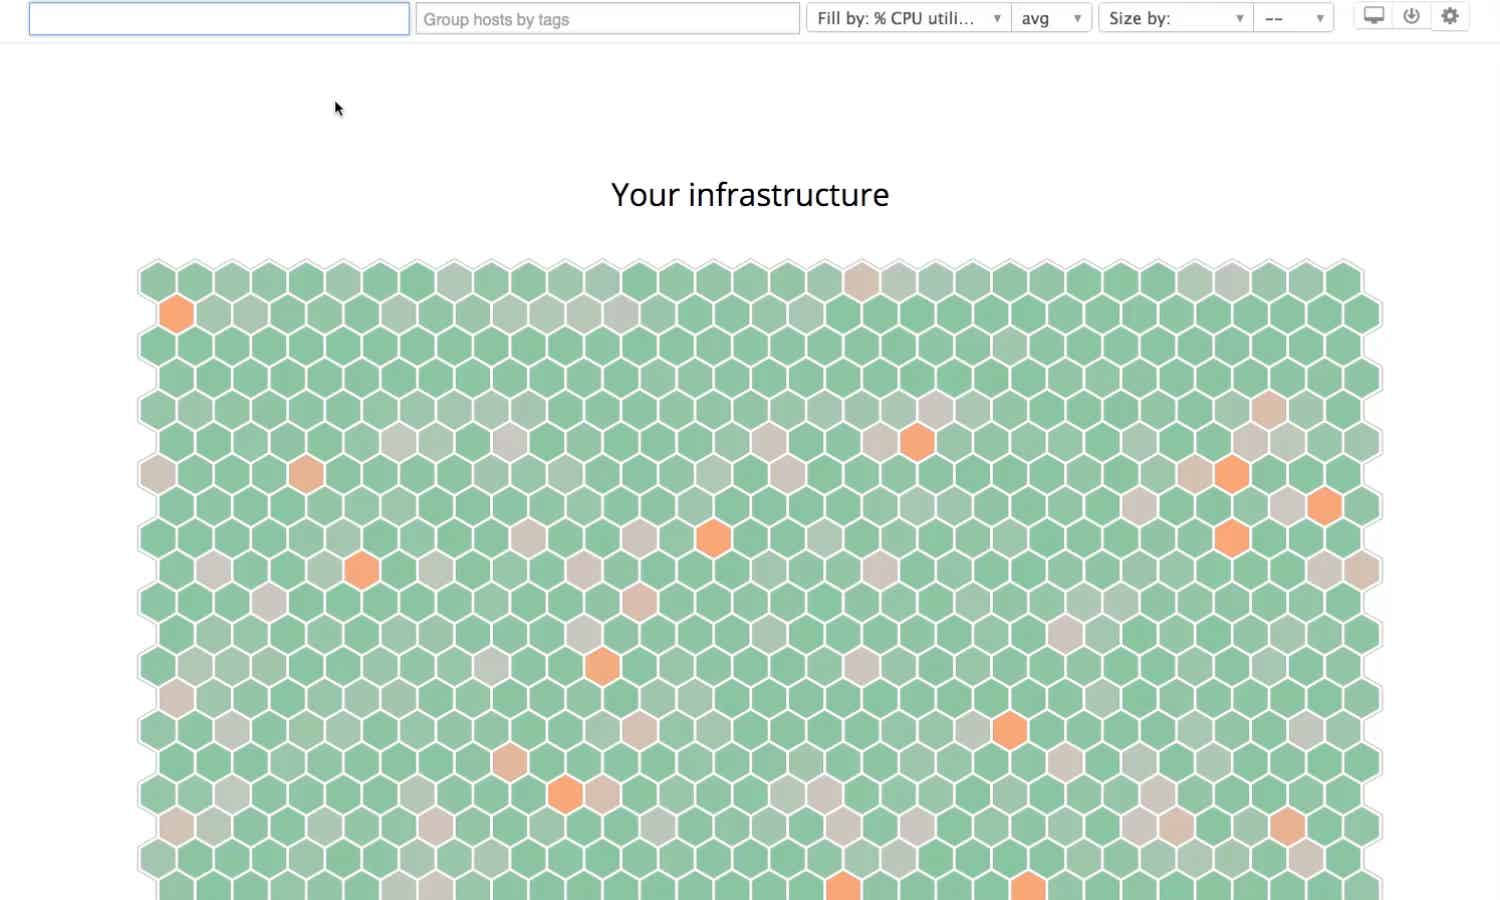
What do you like best about Datadog?We use DataDog primarily for infrastructure monitoring across EC2 instances, EKS clusters, and more. It gives us full visibility into the critical systems we run, mainly on AWS and GCP. “Very functional” is the best way I can describe it, and it consistently provides deep insights into the systems and resources we operate across both services. Review collected by and hosted on G2.com.What do you dislike about Datadog?I think the setup can be a bit complex, and you may need an understanding of things like agents. I also feel it would be better if there were an easier way to cover more of the resources, because setting up the agents wasn’t very straightforward. On top of that, there are quite a lot of monitoring services, so it can get overwhelming pretty quickly. Review collected by and hosted on G2.com.
What do you like best about Datadog?I use Datadog to check logs and audits, and I appreciate how it shows the timestamps of logs and events, which makes communication with the customer easy and allows our engineering team to fix issues faster. I like the RUM logs and replay sessions because the RUM logs provide an accurate log of success and failures, which helps escalate with the engineering team to fix issues, and the replay session allows us to see how the user interacted with the UI. Review collected by and hosted on G2.com.What do you dislike about Datadog?The UI seems cluttered at times with too many elements. It might be better if there were organized sections to easily access information. For example, if there are device-specific details, they should be under a section labeled 'device' where all related details and geolocations can be found. Also, it took some time to get a hang of it initially. Review collected by and hosted on G2.com.
What do you like best about Datadog?I really like how quickly data shows up in Datadog. It's really quick and easy to integrate webhooks with it, and we can search through the results quickly and easily to find examples of integrations working or not working. Being able to dig into API payloads and understand what's causing issues by looking at API responses in Datadog makes troubleshooting a lot easier for me. The ability to build dashboards and metrics to gain insights on our integrations also stands out. Review collected by and hosted on G2.com.What do you dislike about Datadog?Sometimes, once you have searched for something and it has filtered down to a specific context, it can be difficult to know how to expand the context to include other sources. Review collected by and hosted on G2.com.
What do you like best about Datadog?It’s very easy to use and has been really useful for my job. Review collected by and hosted on G2.com.What do you dislike about Datadog?Honestly, there’s nothing I really dislike about it. It’s a very good product overall. Review collected by and hosted on G2.com.
What do you like best about Datadog?I like the concept overall, the system that tracks every data point your applications provide and you can collect and analyse it in a single space. It basically allows to find the root cause of issues much faster as you are able to correlate data from different sources (server load, logs, network performance etc.) And because of all those data agregated in one place you can setup notifications based on multiple metrics together, not just one. Or even do something with webhook. Review collected by and hosted on G2.com.What do you dislike about Datadog?I personally don't really enjoy Datadog's interface, it does look modern and UI elements are small, but I don't have any other complaints so far. Review collected by and hosted on G2.com.
What do you like best about Datadog?What I like best about Datadog is how fast it helps teams understand what’s actually happening in production. The platform brings logs, metrics, traces, and real-time alerts into a single, intuitive view, so you’re not jumping between tools when something goes wrong. That unified observability makes it much easier to identify root causes quickly, especially in complex, distributed systems. Review collected by and hosted on G2.com.What do you dislike about Datadog?Cost can escalate quickly. Pricing is usage-based, so as log volume, metrics, or hosts scale up, it’s easy for costs to grow faster than expected if usage isn’t closely monitored. Review collected by and hosted on G2.com.
What do you like best about Datadog?I like Datadog for its real-time traces and the ability to connect real user monitoring (RUM) with application performance monitoring (APM). This is very useful for me because it helps trace errors and map them with the real user experience. I also find it easy to reproduce cases with the detailed summary available in the dashboard. Review collected by and hosted on G2.com.What do you dislike about Datadog?I find the installation process a bit complex, especially when setting it up on a Docker-based setup. It's very much difficult to set up compared to a normal VM-based server. Review collected by and hosted on G2.com.
What do you like best about Datadog?It brings metrics, logs, traces, and alerts into a single, intuitive platform. Real-time dashboards and powerful visualizations make it easy to identify issues quickly. Review collected by and hosted on G2.com.What do you dislike about Datadog?Fine-tuning alerts and dashboards often takes time to avoid noise and false positives. Review collected by and hosted on G2.com.
Where I'm at with AI Assisted Building + Current and Future Workflow Overview
I've been in an AI dive bomb for probably a couple of years now. The early days... when models couldn't be trusted for more than 5% of the code you wrote. Over the last 2 years that's evolved so quickly that I now write nearly 0% of my code by hand, on personal projects and at work. I've used all kinds of tools in that time too. OpenCode, Zed, Claude Code, Codex, Cursor, Windsurf, OpenCLAW, Lovable... and probably a bunch more I can't recall in the haze that's been AI ADHD for me. Over that time, I started with just copy-pasting code between ChatGPT's interface and my IDE almost like a slightly faster Stack Overflow search. Then that somewhat evolved with Cursor quite a bit. I sort of went from prompt engineering to something closer to a human relay pattern. Then, with Plan Mode becoming a thing, I think I naturally gravitated more towards planning everything because planning felt so cheap. Originally, I used to think that architectural discussion and planning was something that was reserved for larger features, but with expediting my ability to do research, orient myself within a codebase, and know what tools I have to reach for doing technical specifications for everything felt reasonable. From the human relay pattern, I started evolving into more autonomy, especially when Claude Code came out earlier last year. Between the combination of Cursor and Claude Code, starting to get orchestration, starting to use skills more heavily, starting to create actual agent personas that could replace some of my common prompt chains it was around then that I kinda started going all in on true context engineering, utilizing sub-agents optimizing cache reads, and it's probably when many of my first (I call it) sophisticated commands were born. All of this converged pretty rapidly in November of 2025 with the release of what was probably the biggest step increase for AI as far as code quality went with Opus 4.5 and Codex 5.3. The Codex app and Codex CLI were quickly growing. Claude Code was improving at a breakneck pace, introducing all kinds of new ways to introduce deterministic gates within the autonomy of the harness. Fast forward to today, I have a pretty sophisticated workflow with a combination of agents that do everything within the SDLC, commands for almost every type of entry point for work, and skills for just about everything I could possibly do in my day-to-day the workflow with some of the latest tools is able to run quite autonomously overnight do large feature implementations, minimally supervised while producing production-worthy code quality It somewhat reached a point I realized, probably a month and a half ago or so where I needed to figure out a way to remove myself even more from the loop without jeopardizing the determinism that I bring to what is effectively a probabilistic LLM. The models are exceptional, and they seem to have a massive step increase each release, but continuous execution, strict instruction rigor, and preventing hallucinations is still very much difficult to achieve. That's predominantly what I've been doing. I've effectively offloaded a lot of thinking to the agents and LLMs that I use, but none of the understanding. I've asked myself, "How do I maintain that understanding, though maintain the determinism from my steering, without actually physically being there to steer?" This was essential, and I realized or had a bit of an aha moment, just like how I manage teams of engineers that are working on numerous projects, most of which I can never really go too deeply on even though they do most of the thinking, most of the building, and even most of the implementation planning, I was still there, very close to the architecture. I could speak to enough breadth and enough depth to keep us out of trouble and keep things moving I kind of started thinking more about what the shape of me was within the agentic harness and how I could replicate that. More on what I landed on a little bit later. My Setup and How I Work Today To start, I'll probably just talk a little bit about my current working setup. I am predominantly in the terminal now a days using Claude Code. Claude Code orchestrates both the Claude models, of course, and I use it to orchestrate Codex through a series of run books, skills, and commands that I have set up on several hooks so that Codex, when it gets dispatched, also has access to the same skills and agent personas Claude does. I use Ghostty as my terminal of choice and use the IDE integration in claude code pretty heavily to review Markdown or HTML files in my IDE. I also use it to review code snippets and diff reviews, although lately I find myself only really looking at the code nowadays once it's hit a merge request. Some of my adjacent tools are Wispr Flow for faster steering, since I can speak a lot faster than I can type and then I use quite a few MCPs and tools to improve my token usage, but the big ones are I have a custom doc maintenance suite of
View originalClaude was more useful as an inbox filter than a reply writer
Claude got more useful for me when I stopped asking it to write the reply. The actual problem was after a post went up. A few public comments turn into DMs, then someone wants a quick call, someone asks for a repo review, someone drops a Discord, someone has a question that is actually three questions. My instinct was to answer fast because unanswered messages feel like open tabs in your head. That made the answers worse. Too agreeable, too smooth, and also weirdly needy. The fix has been using Claude one step earlier. I paste the message with anything identifying removed and ask for a small triage note: what is this person actually asking, is there a real problem here or just a pitch, can this be answered in text, have I seen this same question three times this week. Then I write the reply myself. The funny part is that it changed what I post publicly. The useful signal was not upvotes. It was the repeated private questions. People do not say "please build a monetization strategy." They say "can you look at this idea", "am I overbuilding", "would you hop on a call", "how do I find clients without sounding spammy." Those are much better notes than whatever I was trying to infer from a score number. I saw Datadog's AI engineering report this week saying roughly 5% of AI model requests fail in production, and a lot of the failures are boring capacity/ops limits. Different scale, but it rhymes. The hard part is not generating more text. It is noticing where the loop keeps breaking. So my tiny Claude workflow now is: public post, messy replies, triage note, plain human answer, write down the repeated ask. It is unglamorous, but it has saved me from taking calls I did not want and from replying like a customer support bot that got a little too much coffee. Is anyone else using Claude this way, more as an inbox/signal filter than as the thing that writes the response? submitted by /u/Ambitious-Garbage-73 [link] [comments]
View originalSRE AGENT(Datadog) using claude
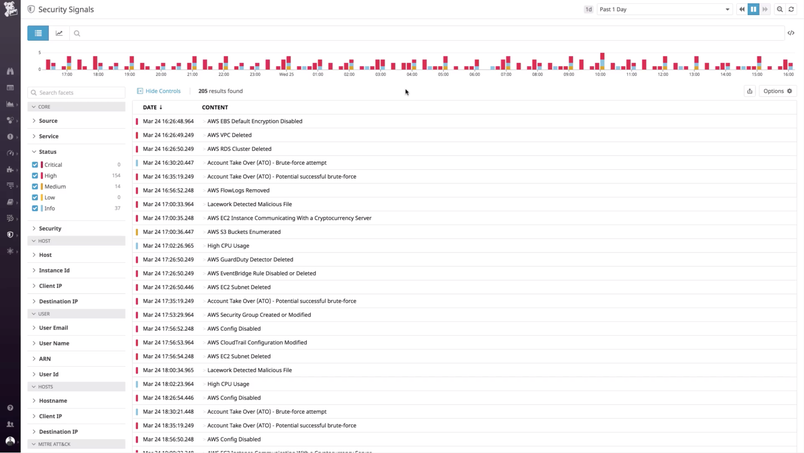
I built an AI-powered SRE agent that investigates production incidents automatically It connects to Datadog, pulls metrics/logs/traces/service maps, and uses Claude to perform multi-phase root cause analysis — discovery, breadth scan, hypothesis-driven deep dive, and cross-service dependency tracking. You can run it from CLI, or drop it into Slack as a bot — reply to a Datadog alert with "@bot investigate" and get a full RCA report in the thread within minutes, including the dependency chain showing exactly how the failure cascaded across services. Open source: https://github.com/atul-007/Sre-Agent I have been using it to investigate prod issues and it has really helped me so please do try Thank you submitted by /u/MasterSkirt6896 [link] [comments]
View originalCloud scheduled tasks can't access MCP connectors — anyone find a workaround or solution? Or have any insight on it beyond what I list here?
Scheduled tasks on Claude Code (cloud, via claude.ai/code/scheduled) can't see any MCP connectors when they fire autonomously. Doesn't matter which connector — I've tested with multiple Zoho connectors and Microsoft 365. The agent runs ToolSearch, finds nothing, and tells you the tools need to be connected. They're connected. They work fine in interactive chat. The tell: if you open the failed session and send any message — literally just "try again" — everything works instantly. No config changes. The tools just appear once a human is in the session. This makes scheduled tasks useless for anything that touches an external service. Email summaries, channel monitoring, CRM lookups, posting to chat platforms — none of it works autonomously. Which is the entire point of scheduling. What I've tried (nothing works): - Deleted and recreated the task - Disabled all connectors on the task, saved, re-enabled, saved - Simplified to a minimal test prompt - Switched models - Different prompt content entirely This SEEMS TO BE a known bug with no workaround. Multiple GitHub issues document it across different connectors (Slack, Datadog, Jira, Zoho, Chrome) and across both Desktop and cloud tasks: #35899 — connectors not available until user message warms session #36327 — same, closed as duplicate #32000 — missing auth scope in scheduled sessions #40835 — editing a task silently disables connectors No one has posted a workaround. No Anthropic team member has commented on any of these issues. I filed my own report since the existing ones are mostly from Desktop/Cowork users — I'm on Teams, cloud-only, no Desktop fallback: 👉 https://github.com/anthropics/claude-code/issues/43397 Anyone else dealing with this? Found anything that works? Workaround Found ! Reddit user /u/e_lizzle was able to identify a workaround that worked for me - it'll cost a few extra tokens but if you start the scheduled task prompt by telling it to not do any work but instead to use an agent to do the entire task - everything works fine because the subagent gets mcp tools initialized properly. Then for now I'm telling it to have the subagent report a summary back up to the primary so I can look at its results in the task log. Cost difference is probably negligible and it solves the problem until its formally fixed. submitted by /u/checkwithanthony [link] [comments]
View originalYou gotta admit that this is cool.
graph TD subgraph Entry["AREA-1: Entry & CLI Parsing"] CLI_TSX["src/entrypoints/cli.tsx\n--version fast-path (zero imports)\nABLATION_BASELINE feature gate"] MAIN["src/main.tsx 4684 LOC\nCommander.js parser\nParallel MDM+Keychain+API prefetch\n9 config migrations on startup"] INIT["src/entrypoints/init.ts\nmemoized init()\nOrder: configs→env→shutdown→1P-events\n→OAuth→JetBrains→remote-settings\n→policy-limits→mTLS→proxy→preconnect"] CMDREG["src/commands.ts 758 LOC\n100+ slash commands\nStatic + feature-gated + ant-only\n+ skills + plugins (dynamic)"] REPL_L["src/replLauncher.tsx\nlaunchRepl() → App+REPL tree"] MCP_EP["src/entrypoints/mcp.ts"] SDK_EP["src/entrypoints/sdk/\n28 HOOK_EVENTS, EXIT_REASONS\nZod-generated types from mcp-server"] end subgraph LLM["AREA-2: LLM Orchestration Core"] QE["src/QueryEngine.ts 1297 LOC / 46KB\nClass: one per SDK conversation\nsubmitMessage() async generator\nOwns: messages, file cache, usage\npermission denial tracking"] QUERY["src/query.ts\nCore streaming loop\nTerminal/Continue state machine\nAutocompact + microcompact\nStop hooks"] QDEPS["src/query/deps.ts\nQueryDeps: callModel, microcompact\nautocompact, uuid (injectable)"] QCONF["src/query/config.ts\nQueryConfig: immutable per-query\nRuntime gates snapshot"] QBUDGET["src/query/tokenBudget.ts\nBudgetTracker: 90% threshold\nDiminishing returns detection"] QTRANS["src/query/transitions.ts\nTerminal: completed/error/aborted\nContinue: tool_use/compact/queued"] end subgraph Tools["AREA-3: Tool System"] TOOL_T["src/Tool.ts 794 LOC\nbuildTool factory\nToolUseContext (full exec env)\nToolPermissionContext (DeepImmutable)"] TOOLS["src/tools.ts 396 LOC\ngetAllBaseTools() — 40+ tools\ngetTools(permCtx) — filtered\nassembleToolPool() — sorted+MCP\nPrompt cache stability via sort"] TOOLDIR["src/tools/ 40+ tool dirs\nAgentTool, BashTool, FileRead/Write/Edit\nGlobTool, GrepTool, WebFetch, TodoWrite\nTaskCreate/Get/Update/List, LSPTool\nMCPTool, ListMcpResources, SkillTool"] end subgraph Coord["AREA-4: Multi-Agent Coordination"] CMODE["src/coordinator/coordinatorMode.ts\nCOORDINATOR_MODE feature gate\nINTERNAL_WORKER_TOOLS set\nmatchSessionMode()"] TASKTY["src/Task.ts + tasks/types.ts\n7 types: local_bash, local_agent\nremote_agent, in_process_teammate\nlocal_workflow, monitor_mcp, dream\nTaskStateBase: disk output, status"] TASKDIRS["src/tasks/\nLocalAgentTask, RemoteAgentTask\nInProcessTeammateTask, DreamTask\nLocalShellTask, LocalWorkflowTask\nMonitorMcpTask"] end subgraph Svc["AREA-5: External Services + Bridge"] CLAUDE_SVC["services/api/claude.ts\nqueryModelWithStreaming()\nMulti-provider: Anthropic/Bedrock/GCP\nBeta SDK, prompt cache breakpoints"] COMPACT["services/compact/\nautoCompact, microCompact\nreactiveCompact (REACTIVE_COMPACT)\nsnipCompact (HISTORY_SNIP, SDK-only)"] MCP_SVC["services/mcp/\nMCPConnectionManager\nInProcessTransport\nelicitationHandler\nchannelPermissions"] BRIDGE["src/bridge/ 25 files\nbridgeMain.ts: HTTP poll + JWT\nbridgeApi, bridgeMessaging\nCCR worktree isolation\nfeature(BRIDGE_MODE)"] OTHER_SVC["services/: oauth, lsp, analytics\nGrowthBook, OpenTelemetry, Datadog\nplugins, policyLimits\nremoteManagedSettings, SessionMemory"] end subgraph UI["AREA-6: React/Ink Terminal UI"] INK_FORK["src/ink/ Custom Ink fork\nreconciler, dom, renderer\nTab status, click events\nSearch highlight, FocusManager"] INK_TS["src/ink.ts\nThemeProvider auto-wrap\nPublic API: Box, Text, hooks"] COMPONENTS["src/components/ 144 components\ndesign-system/: ThemeProvider\nThemedBox, ThemedText, color\nPromptInput, MessageResponse\nPermissionRequest, VirtualList"] REPL_SCR["src/screens/REPL.tsx 5006 LOC\nReact Compiler enabled\nIntegration hub: permissions\nMCP elicitation, task nav\nSwarm permission polling"] end subgraph Perms["AREA-7: Permissions & Hooks"] PERM_SYS["src/utils/permissions/ 24 files\n6 modes: default, plan, acceptEdits\nbypassPermissions, dontAsk, auto\nRule parser: Bash(git *) wildcards\nML classifier (TRANSCRIPT_CLASSIFIER)\nbypassKillswitch"] HOOKS["src/hooks/\nuseCanUseTool (central perm check)\nuseSettings, useCommandKeybindings\nfileSuggestions, toolPermission/"] end subgraph Utils["AREA-8: Utilities + Skills + Plugins"] UTILS["src/utils/ 329 modules\nbash, git, auth, settings/\nmodel/, telemetry/, swarm/\nsandbox/, secureStorage/\nstartupProfiler, config, messages"] SKILLS["src/skills/ + src/plugins/\nbundledSkills, loadSkillsDir\nSkillTool, MCP skill builders\nbuiltinPlugins, plugin commands"] end subgraph State["AREA-9: State & Config"] STORE["src/state/\ncreateStore (custom pub-sub)\nAppStateStore (570 LOC)\nSpeculationState (pre-computation)\nselectors, onChangeAppState"] CONFIG["src/schemas/ + src/migrations/\nZod v4 schemas\n10 one-shot startup migrations\n(model name + settings migrations)"] end subgraph External["AREA-10: External Systems"] WEB["web/ — Next.js dashboard\nApp Router, ink-app/\nvercel + helm deployment"] MCP_SRV["mcp-server/ — st
View original[D] Real-time multi-dimensional LLM output scoring in production, what's actually feasible today?
I'm deep in research on whether a continuous, multi-dimensional scoring engine for LL outputs is production-viable, not as an offline eval pipeline, but as a real-time layer that grades every output before it reaches an end user. Think sub-200ms latency budget across multiple quality dimensions simultaneously. The use case is regulated industries (financial services specifically) where enterprises need provable, auditable evidence that their Al outputs meet quality and compliance thresholds, not just "did it leak Pil" but "is this output actually accurate, is it hallucinating, does it comply with our regulatory obligations." The dimensions I'm exploring: Data exposure - PIl, credentials, sensitive data detection. Feels mostly solved via NER + regex + classification. Low latency, high confidence. Policy violation - rule-engine territory. Define rules, match against them. Tractable. Tone / brand safety - sentiment + classifier approach. Imperfect but workable. Bias detection, some mature-ish approaches, though domain-specific tuning seems necessary. Regulatory compliance, this is where I think domain-narrowing helps. If you're only scoring against ASIC/APRA financial services obligations (not "all regulations everywhere"), you can build a rubric-based eval that's bounded enough to be reliable. Hallucination risk, this is where I'm hitting the wall. The LLM-as-judge approach (RAGAS faithfulness, DeepEval, Chainpoll) seems to be the leading method, but it requires a second model call which destroys the latency budget. Vectara's approach using a fine-tuned cross-encoder is faster but scoped to summarisation consistency. I've looked at self-consistency methods and log-probability approaches but they seem unreliable for production use. Accuracy, arguably the hardest. Without a ground truth source or retrieval context to check against, how do you score "accur V on arbitrary outputs in real time? Is this even a well-defined problem outside of RAG pipelines? My specific questions for people who've built eval pipelines in production: • Has anyone deployed faithfulness/hallucination scoring with hard latency constraints (<200ms)? What architecture did you use distilled judge models, cached evaluations, async scoring with retroactive flagging? • Is the "score everything in real time" framing even the right approach, or do most production systems score asynchronously and flag retroactively? What's the UX tradeoff? • For the accuracy dimension specifically, is there a viable approach outside of RAG contexts where you have retrieved documents to check against? Or should this be reframed entirely (e.g., "groundedness" or "confidence calibration" instead of "accuracy")? • Anyone have experience with multi-dimension scoring where individual classifiers run in parallel to stay within a latency budget? Curious about the infrastructure patterns. I've read through the Datadog LL Observability hallucination detection work (their Chainpoll + multi-stage reasoning approach), Patronus Al's Lynx model, the Edinburgh NLP awesome-hallucination-detection compilation, and Vectara's HHEM work. Happy to go deeper on anything I'm missing. trying to figure out where the technical boundary is between "buildable today" and "active research problem." If anyone has hands on experience here and would be open to a call, I'd happily compensate for your time. submitted by /u/dmc_3 [link] [comments]
View originalYes, Datadog offers a free tier. Pricing found: $1, $2, $240, $200, $160
Datadog has an average rating of 4.4 out of 5 stars based on 20 reviews from G2, Capterra, and TrustRadius.
Key features include: SaaS and Cloud providers, Automation tools, Monitoring and instrumentation, Source control and bug tracking, Databases and common server components, All listed integrations are supported by Datadog, Trace requests from end to end across distributed systems, Track app performance with auto-generated service overviews.
Datadog is commonly used for: Infrastructure monitoring, Application performance monitoring, Log management, Real-user monitoring, Cloud migration support, Digital transformation enablement.
Datadog integrates with: AWS, Google Cloud Platform, Microsoft Azure, Kubernetes, Docker, Slack, Jira, GitHub, PagerDuty, New Relic.
Ankur Goyal
CEO at Braintrust
1 mention

Running a Security Program Without a Dedicated Team
Apr 8, 2026
Based on user reviews and social mentions, the most common pain points are: token usage.
Based on 11 social mentions analyzed, 9% of sentiment is positive, 91% neutral, and 0% negative.


